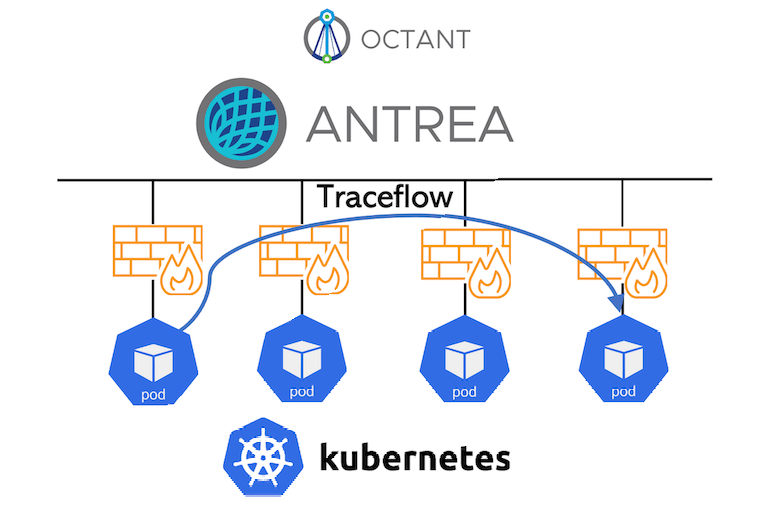
In this blog I will explain how to troubleshoot pod-to-pod or pod-to-ip traffic with a new function in Antrea called Traceflow, and visualize it with Octant UI.
Traceflow enables a CRD API for Antrea that supports generating tracing requests for traffic going through the Antrea-managed Pod network. This is useful for troubleshooting connectivity issues, e.g. determining if a NetworkPolicy is responsible for traffic drops between two Pods. Refer to this document for more information. Source
First we need to deploy Antrea with Octant Plugin as explained in my previous Blog Deploying Antrea on Mac with Octant Plugin
Deploy a Test Application
Let us deploy a Test Application,kubectl create ns hipsterkubectl apply -f https://raw.githubusercontent.com/aidrees/k8s-lab/master/demo-app.yml -n hipster
We need to change the Frontend Service type from LoadBalancer to NodePort (can be done in CLI or through Octant). Let’s do it from Octant just for fun!
(if you are not familiar with Octant, please go to my previous blog Deploying Antrea on Mac with Octant Plugin

Create a Network Policy that will restrict the traffic between the Frontend and the Catalog to port TCP-3550,kubectl apply -f https://raw.githubusercontent.com/aidrees/k8s-lab/master/np-productcatalog.yml -n hipster
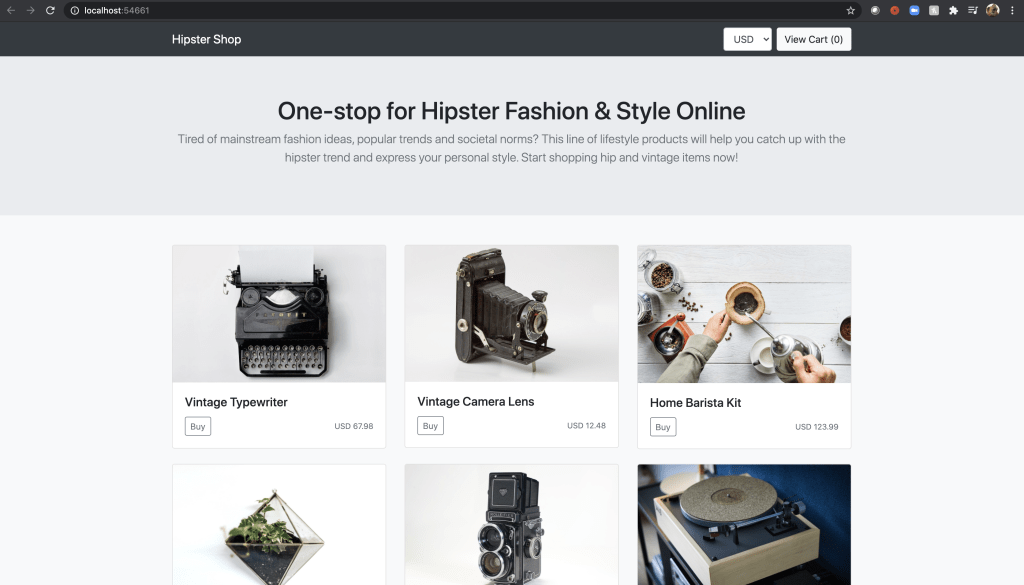
We can access the application easily from Octant using Port Forward,

Click on the link and you should see your Hipster Shop as below,
Enabling Antrea TraceFlow
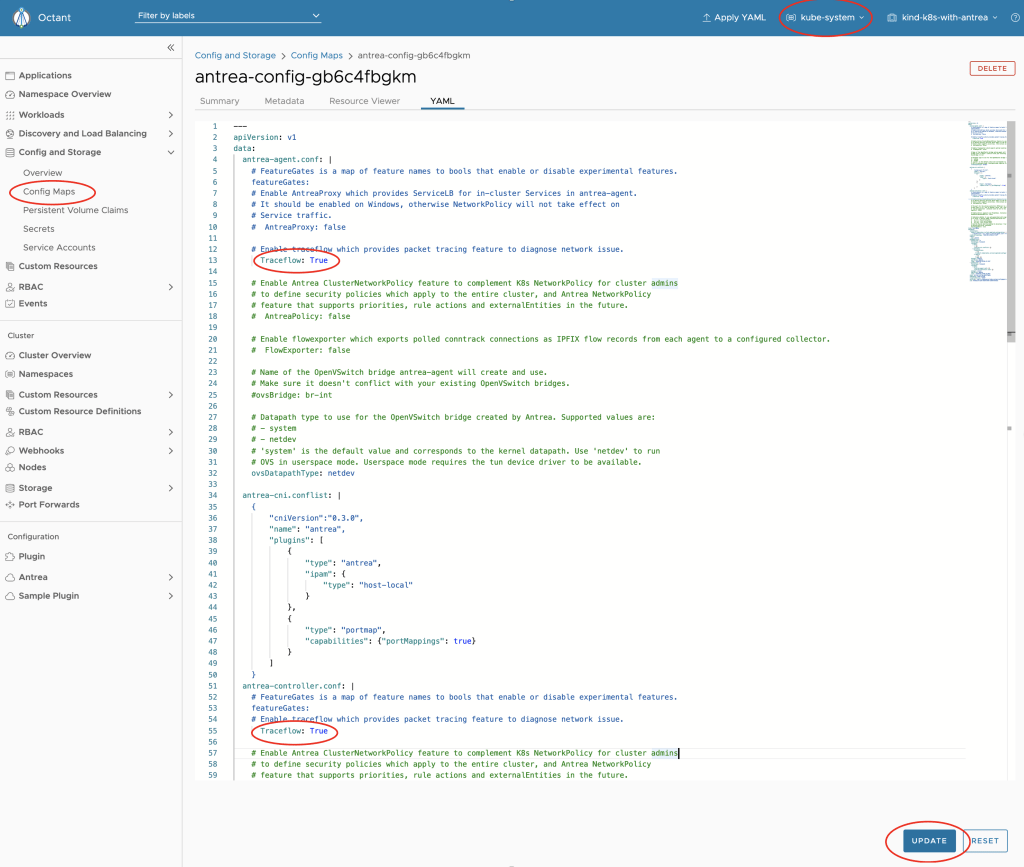
TraceFlow is not enabled yet in Antrea by default. we can do that by doing some changes in the antrea config-map which could be found in the kube-system NameSpace:
Uncommenting Traceflow: false
and changing false to True
We need to do above changes twice in the config-map. once for the antrea-agent and another one for the antrea-controller as shown below,
Lets do it through Octant
(Can be done through CLI Command kubectl edit cm antrea-config-xxxxxxx -n kube-system),
Testing TraceFlow
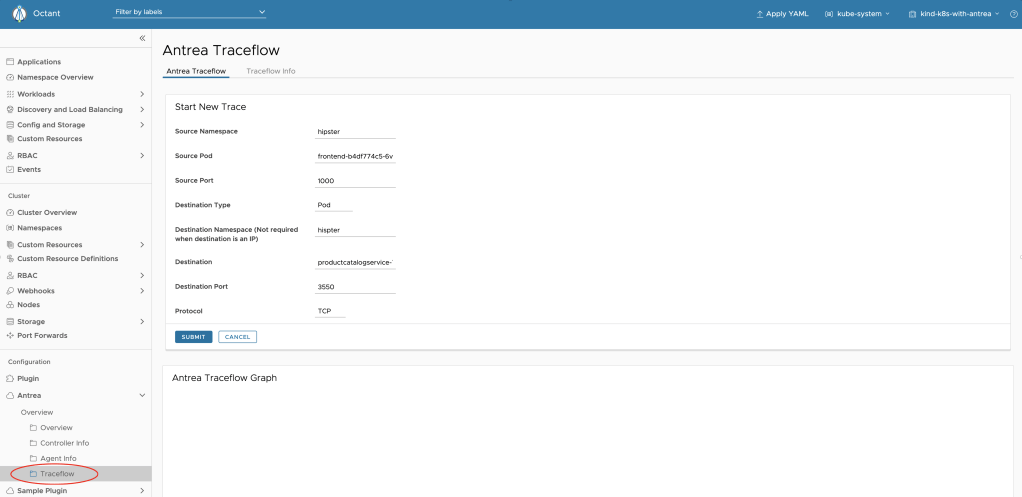
We can emulate traffic between Pods or from a Pod to an IP address. In below example, I am doing a Traceflow between Hipster app FrontEnd pod and Catalog pod where I applied a Network Policy previously.
Lets try with Port TCP-3550 which is allowed by the Network Policy we applied previously,
We should get this nice traffic flow diagram which shows the traffic is going through as expected.

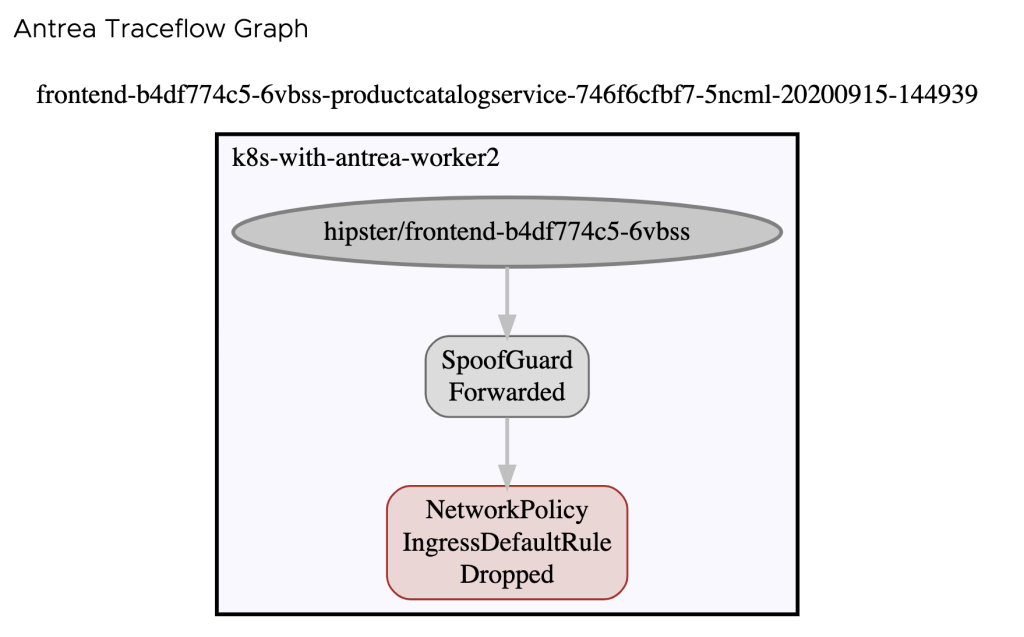
Now let’s test with a blocked port by our Network Policy. This could be done by starting a New Trace and changing the Destination Port to anything other than 3550.
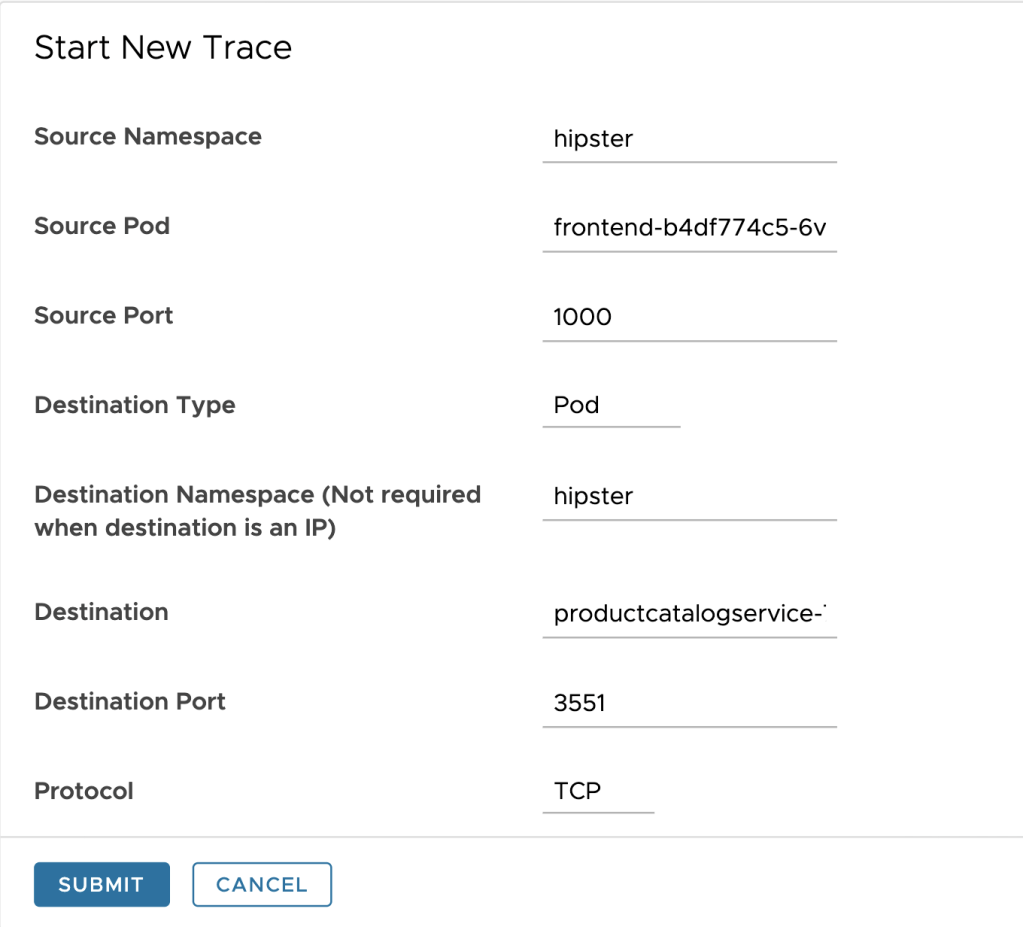
We should get below diagram which shows that our Network Policy will drop the traffic.
Conclusion
In this blog I showed how Antrea Traceflow could be used to troubleshoot the connectivity between K8s Pods and IP addresses. This function could be very handy to isolate the problem by emulating Network traffic between K8s Pods or between a K8s pod and an IP address. The ability to visualize the result with Octant is a great addition to this function.
Both Antrea and Octant are Open Source, so go ahead and give it a try and share your feedback.
Thank you for reading!
